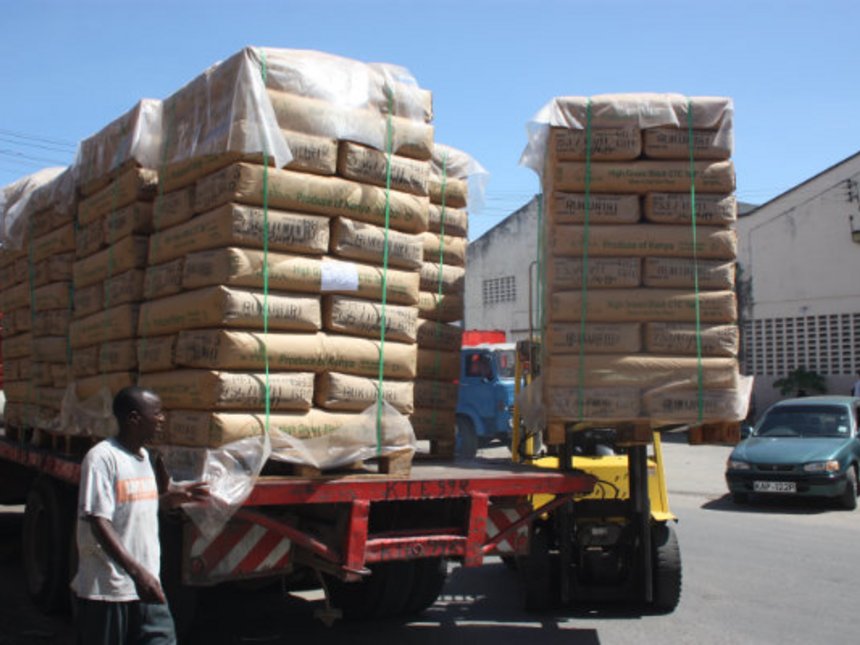
Uganda’s formal exports to the East African Community (EAC) Partner States more than doubled in the last seven years, increasing from US $ 425.2 million in 2010 to US $1,113.4 million in 2017, according to the Ministry of Finance Planning and Economic Development.
Data shows that Kenya continued to dominate the importation of Uganda’s formal exports as shown in Figure 3.1 below. Formal exports to South Sudan picked up strongly in 2017 at US $ 316.5 million compared to US $ 239.3 million 2016.
In contrast, formal exports to Rwanda have been on a consistent decline from US $ 245.4 million in 2014 to US $ 180.6 million in 2017. Compared to other EAC Partner States, Uganda’s formal exports to Tanzania have remained low.
Finance Minister Matia Kasaija says government will in the financial year 2018/19 as well as in the medium term continues to fully explore trade opportunities within the region through putting in place mechanisms and measures for ensuring increased formal exports across all the Partner States.
However, Kasaija says the informal exports have continued to dominate Uganda’s export basket. Democratic Republic of Congo is the largest market for Uganda’s informal exports in the region followed by Kenya. Informal exports to South Sudan have been on a downward trend over the past three years.
According to minister Kasaija, enhancing efforts to increase formal trade links among Partner States has always been the main drive since 2005 when the customs union commenced. Despite the efforts and policy pronouncements to promote trade integration, EAC Partner States face constraints that continue to drive traders into informal trade. “It has been found in the past that there are exclusive incentives that pull traders to remain operating in the Informal Cross Border Trade (ICBT),” he says.
The 2016 Informal Cross Border Trade Survey by Bank of Uganda showed that in 2016, industrial products dominated informal trade exports, while agricultural products dominated informal imports. The market shares for both commodities stood at 67.3 per cent for informal exports and 59.9 percent for informal imports respectively.
Industrial informal exports increased by 10.8 percent from US$ 251.7 million in 2015 to US $ 282.2 million in 2016. The survey also showed that the Democratic Republic of Congo (DRC) was the major destination for most of the industrial exports earnings. Industrial exports were estimated at US $ 171.8 million, representing 60.8 per cent of the informal industrial exports in 2016. This is high when compared to US $130.9 million, about 52.0 per cent recorded in 2015.
During the same period, agricultural exports earnings fell from US $146.2 million in 2015 to US $135.2 million in 2016. Exports of other products increased to US $1.8 million in 2016 from US $ 1.1 million recorded in 2015. The main destinations for Agriculture and Other products were DRC, Kenya, South Sudan and Tanzania.
According to the survey, the leading exit borders for informal exports were Mpondwe (DRC), Elegu (South Sudan), Busia (Kenya), Katuna (Rwanda) and Mutukula (Tanzania). They accounted for the largest share of informal exports, representing a combined share of 72.1 per cent of informal exports. The survey results indicated that Mpondwe accounted for an estimated US$ 137.1 million of informal exports, representing about 32.7 per cent. It was followed by Busia (US $ 69.1 million, 15.8 per cent), and Elegu (US $36.6 million, 8.7 per cent).


