|
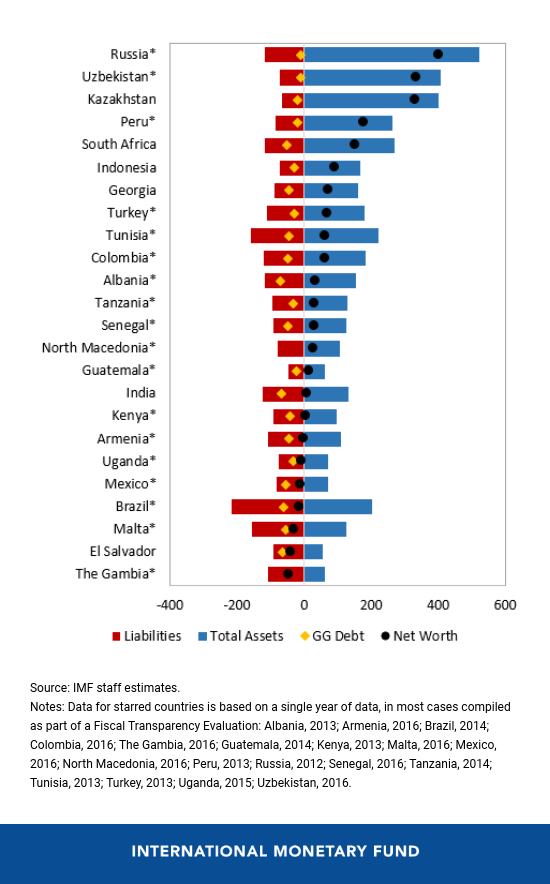
By Jason Harris, Abdelhak Senhadji, and Alexander F. Tieman Our new data on government assets shows that when governments know what they own, they can make better use of the assets for the well-being of all their citizens. We make these data free and publicly available for all to use because we believe transparency can help create better public policy. The chart shows that advanced economies have larger balance sheets compared to emerging markets and low-income developing countries. This reflects the size of their public sectors, which generally provide more infrastructure and services. But advanced economies also have larger liabilities and, on average, lower net worth. We wrote about countries’ assets back in October in the Fiscal Monitor and in our blog about what countries own and owe, and now we have the full data set. New countries, new numbers The database covers 38 countries’ public assets and liabilities and includes low-income, emerging market, and advanced economies. It expands coverage from the October Fiscal Monitor by adding seven countries: Mexico, Malta, North Macedonia, Senegal, Armenia, Uzbekistan, and Lithuania. The countries in the database now cover almost 63 per cent of global GDP. For 17 countries we have time series data at the public sector level. We provide granular data on what assets countries hold, like land, buildings, cash, and equity, as well as the liabilities, such as debt, loans, and pensions. We provide the data by level of government and include both financial and nonfinancial corporations. The total public sector assets in the countries covered are worth $103 trillion, or 216 per cent of GDP. These assets consist of public infrastructure such as bridges and roads, financial assets such as bank deposits, as well as natural resource reserves in the ground. Total liabilities stand at $93 trillion. This comprises some US $44 trillion of general government debt, but also includes $22 trillion of current pension obligations and the debt of state-owned enterprises. Net worth—assets minus liabilities—comes to $10 trillion or 21 per cent of GDP for this group of countries. The goal of knowing more about what you own and owe is to better assess fiscal risks and evaluate government policies. The Fiscal Monitor shows that having large assets does not necessarily reduce how vulnerable a country is to large debts; this will depend on the nature of the assets. The Fiscal Monitorincludes a fiscal stress test for the United States, analysis of public investment plans financed by a domestic revenue mobilization effort in Indonesia, and the crossholdings within the public sector in Japan, to name a few. These data on public sector balance sheets also help governments actively manage their balance sheets. Better management of government assets could earn 3 percent of GDP in extra revenues each year—that is more than the interest payments advanced countries pay to cover their debt. There are a range of examples of countries doing just this: the United Kingdom spent several years compiling data and is currently undertaking a balance sheet review. Australia and New Zealand have also looked at the balance sheet effects of policies for years. More recently, the IMF has used the public sector balance sheet approach in consultations with member countries, for instance in some of the Nordic countries. And investors and financial market experts have shown an interest in both the data and the tools, like fiscal stress tests, that use these data. We have made it free and available to all to also encourage more research. Academics and research institutions can use it to better understand the state of a government’s finances and their evolution over time; to compare developments across similar countries; to explore key questions around balance sheets and macroeconomic links; and to enable a more meaningful debate around returns on public assets.
|
A Global Picture of Public Wealth


